STUDY OF THE PERFORMANCE OF THE K* ALGORITHM IN
INTERNATIONAL DATABASES
1MSc. Professor, Computer Science Department, Universidad de Camagüey Ignacio Agramonte
2Professor of Computer Science Department, Universidad de Camagüey “Ignacio Agramonte”
3Professor of Computer Science Department, Universidad de Camagüey “Ignacio Agramonte”
Email: yoan.martinez@reduc.edu.cu, julio.madera@reduc.edu.cu, ireimis.leguen@reduc.edu.cu
This paper presents an experimental study of K* algorithm, which was compared with five classification algorithms of the top ten data mining algorithms identified by the IEEE International Conference on Data Mining (ICDM), which are C4.5, SVM, kNN, Naive Bayes and CART. The experimental results show a satisfactory performance of K* algorithm in comparison with these approaches.
Keywords: Classification, K* algorithm, experimental, accuracy, data.
Recibido 2 de Abril de 2016. Aceptado: 12 de Diciembre de 2016
Received: April 2nd, 2016. Accepted: December 12th, 2016
ESTUDIO DEL COMPORTAMIENTO DEL ALGORITMO K * EN BASES DE DATOS INTERNACIONALES
RESUMEN
Este trabajo presenta un estudio experimental del algoritmo K*, el cual se comparó con cinco algoritmos de clasificación de los diez principales algoritmos de minería de datos identificados en la Conferencia Internacional IEEE sobre Minería de Datos (ICDM), los cuales son C4.5, SVM, kNN, Naive Bayes y CART. Los resultados experimentales muestran un rendimiento satisfactorio del algoritmo K* en comparación con estos enfoques.
Palabras clave: Clasificación, algoritmo K*,experimental, precisión, datos.
Cómo citar este artículo: Y. Martínez-López et al, “Study of the performance of the k* algorithm in
international databases” Revista Politécnica, vol. 12, no. 23, pp. 51-56, 2016.
Machine Learning [1] is a field of science that deals with the design of computer programs and systems that can learn rules from data, adapt to changes, and improve accuracy or performance with experience. Now, with these learning rules we can obtain many algorithms [2], such as Decision Trees, Support Vector Machines, K- Nearest Neighbor, naive Bayes and K*, that are used to classify a data set from real problems.
The K* algorithm [2] is a classifier that uses entropy as a distance measure, as a stronger approximation to handling symbolic, real-valued attributes and missing values. This algorithm is an instance-based learner which uses such an evaluation.
In this experiment, we wants to analyze the development of the K* algorithm versus five of the most important classification algorithms in the machine learning literature [2]. Those algorithms are:
The Naives Bayes classifier algorithm [3], which is based on Bayes’s rule, which express two criteria, the probability of an event before evidence is seen, and the probability of an event after evidence is seen. This classifier is used for many reasons, for example, it is simplest to build, not needing any complex iterative parameter evaluation schemes.
The Support Vector Machine (SVM)[2] finds the best function of classification to decide between elements of the two classes in the training set. SVM substitutes all missing values and changes nominal features into binary. In addition, this algorithm normalizes all features by default.
The K- Nearest Neighbor (kNN) algorithm [5] is the basic instance based learners that use several domain particular function of distance to recover the only the most analogous case from the training set. The classification of the recovered case is given as the classification for the new case.
The Classification and Regression Tree (CART) algorithm, created by Breiman [6], is a binary recursive partitioning method able of processing continuous and nominal features both as goals and predictors. This algorithm creates a sequence of nested pruned trees, where all of them are candidate optimal trees and add automatic class balancing, missing value handling, and allows for cost-sensitive learning, dynamic feature building, and probability tree estimation.
The C4.5 algorithm was created by Ross Quinlan [7] to deal with datasets that contain numeric attributes, missing values and noise data. This algorithm generates a classifier expressed as a decision trees. This classifier takes as put in a collection of examples, every belonging to one of a little number of classes, described by its values for a permanent set of features, and outputs a classifier that can exactly predict the class to which a new example belongs.
2. METHODS
The K* algorithm was defined by Cleary et al[8], this algorithm uses Information Theory to calculate the distance between two instances with the K* function, defined as:
K* (C|a) = −log2 P * (C|a) (1)
Where P(C|a) is the summation probability of an example of being in category C by summing the probabilities from a to each example that is a member of C[8].
This algorithm was implemented into the Weka 3.6.10 software [8], in a class called “KStar”, into the Lazy classifiers package. WEKA (Waikato Environment for Knowledge Analysis) is Javabased Machine Learning and Data Mining Tool that implements numerous classifiers [8]. Some researchers had used this algorithm in different studies, for example [9][10][11].
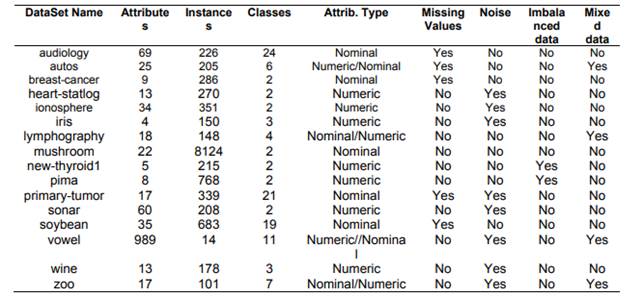
For the study of the accuracy of the classification of the K* algorithm and five of the most important classification algorithms (Naives Bayes, SVM, KNN with K values equal to 1, 3, 5; CART and C4.5), we selected sixteen data-sets from UCI Repository Database, taking into account the following characteristics: missing values, attribute type, noise data, imbalanced and mixed data (for more information of the data-sets, see table 1).
Table 1 Dataset information from UCI Repository Database
With those data-sets, the performance of accuracy of the classification of these classifiers were computed.
Now, for the comparison of those classification algorithms, we used the Weka 3.6.10 software [12] to calculate the accuracy after applying ten-fold cross validation as an experiment type. The ten-fold cross validation [4] collected probabilities for instances in each test fold and sorted instances according to probabilities.
For the statistical analysis [11], we used the Friedman test [13][14][15][16], that is a nonparametric equivalent of the ANOVA [11]. It ranks the algorithms for each dataset separately, the best performing algorithm getting the rank of 1, the second best rank 2,..., the Nth best rank gets N. This test was implemented in a free software, called Keel [17], which calculated the significant remainder of the different algorithms.
For the analysis and comparison of the algorithm, we took into account the results of the accuracy of the classification of the algorithms after applying ten-fold cross validation as experiment type, see table 2.
We carried out several studies using these results, such as studies of performance of the accuracy of the algorithms, with data-sets that contain missing values, noise data, imbalanced data and mixed data. We used the average rank method for ranking the algorithms from these results.
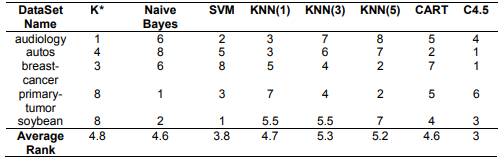
We arrived to the conclusion that the K* algorithms, for the datasets with missing values (audiology, autos, breast-cancer, primary-tumor, soybean), had a normal performance on the accuracy of the classification. The average rank of the K* algorithms was 4.8, this average rank was better that 5-KNN and 3-KNN, see table 3.
Table 2 Accuracy of the classification of the algorithms
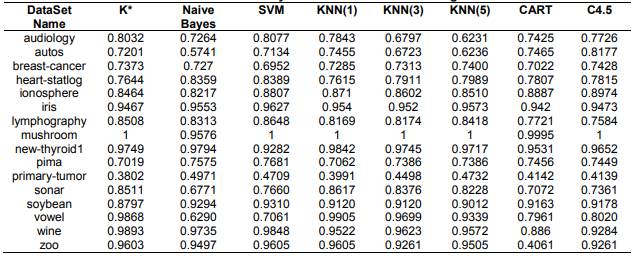
Table 3 Ranking of the accuracy of the classification of the algorithms for the missing values
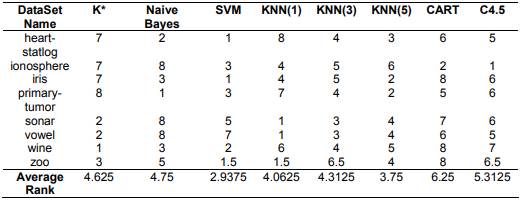
For the datasets with noise data (heart-statlog, ionosphere, iris, primary tumor, sonar, vowel, wine), the K* algorithm had a good performance of the accuracy of the classification. The average rank of the K* algorithms was 4.625, being better that Naive Bayes, CART and C4.5, see Table 4.
Table 4 Ranking of the accuracy of the classification of the algorithms for the data with noise
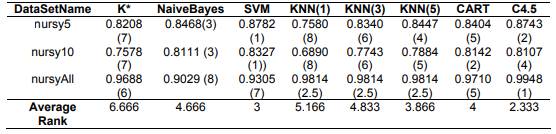
We carried out another study, with a dataset called “nursy”, which we divided in three data-set for the study of the performance of the noise data. We obtained the following result, the K* algorithm had the worst accuracy performance for this dataset, see Table 5.
Table 5 Ranking of the accuracy of the classification for the “nursy” dataset
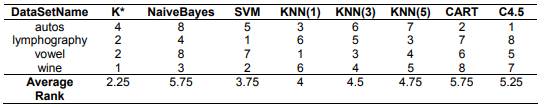
The K* algorithm for the data-sets with mixed data (autos, lymphography, vowel and wine), had the best performance of the accuracy of the classification, with average rank of 2.25, see Table 6.
Table 6 Table Ranking of the accuracy of the classification for the data-sets with mixed data
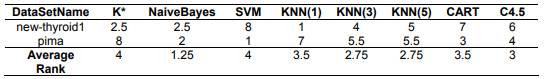
The K* algorithm for the data-sets (new-thyroid1 and pima) with imbalanced data, had the worst accuracy performance of the classification, see table 7.
Table 7 Ranking of the accuracy of the classification for the datasets with imbalanced data
Now, we carried out a general study about the performance of the accuracy of the K* algorithm using the sixteen datasets of UCI Repository Database.
Table 8 Average Rankings of the algorithms
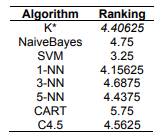
We used the Friedman test for ranking the algorithms and we obtained the following result: the K* algorithm had a good performance, being better than C4.5, CART, 5-NN, 3-NN and Naive Bayes, see Table 8.
For this experimental study, the p-value computed by Friedman test is 0.256 and distributed according to chi-square with 7 degrees of freedom is 8.953, and it is express how similar to the best the algorithm.
We arrived to the conclusion that the K* algorithm hadn’t significant remainder with the five of the most important classification algorithms by have P-value = 0.256 >0.05.
In the present article, we have analyzed and made comparisons of the K* algorithm versus five of the most important classification algorithms of the top ten data mining algorithms. We took into account datasets that contain missing values, noise data, imbalanced data and mixed data. Another comparison with the classification algorithms that we made took into account the sixteen datasets of the UCI Repository Database. The ten-fold cross validation and Friedman test was what allowed us to carry out the experimental study of the K* algorithm. The results of the experimental study demonstrated that the good performance of the K* algorithm taking into account five classification algorithms of the top ten data mining algorithms identified by the IEEE International Conference on Data Mining (ICDM).
This work has been sponsored by VLIR-UC Project of the Phd School from UCI, Cuba.
[1] Ian H Witten, Eibe Frank, and Mark A Hall. Data Mining: Practical Machine Learning Tools and Techniques: Practical Machine Learning Tools and Techniques. Elsevier, 2011.
[2] Xindong Wu, Vipin Kumar, J Ross Quinlan, Joydeep Ghosh, Qiang Yang, Hiroshi Motoda, Geoffrey J McLachlan, Angus Ng, Bing Liu, S Yu Philip, et al. Top 10 algorithms in data mining. Knowledge and Information Systems, 14(1):1–37, 2008.
[3] David J Hand and Keming Yu. Idiot’s bayes not so stupid after all? International Statistical Review, 69(3):385–398, 2001.
[4] Tang L. Lui H. Refaeilzadeh, P. K-fold CrossValidation. Arizona State University, 2008.
[5] Thomas Cover and Peter Hart. Nearest neighbor pattern classification. Information Theory, IEEE Transactions on, 13(1):21–27, 1967.
[6] L. Breiman, J.H. Friedman, R.A. Olshen, and C.J. Stone. Classification and Regression Trees. Chapman and Hall (Wadsworth and Inc.), 1984. [7] J.R. Quinlan. C4.5: Programs for Machine Learning. Morgan Kauffman, 1993.
[8] J.G. Cleary and L.E. Trigg. K*: An instancebased learner using an entropic distance measure. In Proceedings of the 12th International Conference on Machine Learning, pages 108–114, 1995.
[9] Tejera Hernández, Dayana C. "An Experimental Study of K* Algorithm “, Information Engineering and Electronic Business, 2015, 2, 14-19
[10] Uzun, Y. And G. Tezel, Rule Learning With Machine Learning Algorithms And Artificial Neural Networks. Journal of Seljuk University Natural and Applied Science, 2012. 1(2).
[11] Er, E., Identifying At-Risk Students Using Machine Learning Techniques: A Case Study with IS 100. International Journal of Machine Learning and Computing, 2012. 2(4): p. 279
[12] Mark Hall, Eibe Frank, Geoffrey Holmes, Bernhard Pfahringer, Peter Reutemann, and Ian H Witten. The weka data mining software: an update. ACM SIGKDD Explorations Newsletter, 11(1):10– 18, 2009.
[13] Janez Demšar. Statistical comparisons of classifiers over multiple data sets. The Journal of Machine Learning Research, 7:1–30, 2006.
[14] R. A. Fisher. Statistical methods and scientific inference (2nd edition). MHafner Publishing Co., New York, 1959.
[15] Milton Friedman. The use of ranks to avoid the assumption of normality implicit in the analysis of variance. Journal of the American Statistical Association, 32(200):675–701, 1937.
[16] Milton Friedman. A comparison of alternative tests of significance for the problem of m rankings. The Annals of Mathematical Statistics, 11(1):86– 92, 1940.
[17] Alcalá-Fdez, J., et al., KEEL: a software tool to assess evolutionary algorithms for data mining problems. Soft Comput., 2009. 13: p. 307–318.