1. INTRODUCCIÓN
Natural organic matter (NOM) includes a variability of compounds from aliphatic to aromatic highly colored, with different structures, chemical charges, molecular sizes and molecular weights [1, 2]. The NOM in water can be derived from distinct sources: allochthonous (organic material coming from runoff), autochthonous (NOM from biological activity within the body of water) and anthropogenic [3]. Humic substances (HS) are the predominant fraction in the aquatic NOM. HS are the hydrophobic moiety in NOM. This is described as heterogeneous polymers generated by the decomposition of the tissues of plants and animals and/or synthesis of products through biological and chemical processes [4].
Non-humic substances constitute the hydrophilic portion of NOM and are difficult to remove by conventional treatment processes [1], which includes only coagulation, sedimentation and filtration [5] Most of the NOM is dissolved, and is commonly quantified as DOC (dissolved organic carbon) and as UV absorbance at 254 nm (UV254) [1]. Some features of the NOM can be deduced by the specific UV absorbance (SUVAλ), which is the ratio between the absorbance at a particular wavelength λ and the DOC [6].
The DBPs are generated when the disinfectants are applied on water which contains aquatic organic matter. NOM has been identified as the main contributor to DBPs [7]. DBPs are related to the development of cancer and trouble on reproduction and growth of the people [8, 9]. The most thoroughly researched DBPs are THMs and HAAs [10], which constitute the greatest fraction by weight. Organic matter in water influences the organoleptic quality [1]. It affects the performance of processes (oxidation, coagulation, adsorption, disinfection) [11].
It increases coagulant and disinfectant demand and the sludge in the process [1,10]. It reduces biological stability in the distribution system (creates biofilms and biological regrowth) [10, 11]. According to the EPA, NOM removal by enhanced coagulation is the best practice for managing the generation of DBPs in conventional water treatment. This practice can be carried out by increasing the dose of coagulant, adjusting the pH to the optimal range and applying a pre-oxidizing [12]. Preoxidation has little impact on the concentration of NOM at the low doses commonly used in water treatment. However, it may change the reactivity of the NOM to chlorine and affects subsequent DBPs formation because it can convert inactive compounds to chlorine at many sites in the organic matter [13]. It has been reported that pre-oxidation causes the reduction of THMs, HAAs and total organic halogens after chlorination [14]. Pre-oxidation generally improves coagulation, flocculation and sedimentation [15, 16]. Pre-oxidation with chlorine dioxide has increased in recent years, as the ClO2 does not react with NOM to the same degree as chlorine and can reduce the formation of DBPs [17, 18].
The purpose of this research was to determine the effect of process of pre-oxidation with ClO2 followed by a conventional water treatment process, on the formation of THMs and of HAAs at a laboratory scale, which simulates a water treatment system located in the tropics. In addition, finding correlations between water quality variables analyzed to infer on the level of THMs and of HAAs that could be formed in the treated water.
2. MATERIALS AND METHODS
Study area. The water source of the treatment plant is a reservoir located in the tropic, which has a total volume of 240 Mm3. The flooded area is around 1100 ha and its drainage basin covers an estimated 100000 ha. The sector surrounding the reservoir is planted with pine forests. There are agriculture and livestock in the basin. The small towns in the area lack efficient wastewater treatment, affecting the reservoir water.
The water treatment plant is located in the municipality of Bello (Antioquia, Colombia). It has a nominal capacity of 6 m3/s. It employs a conventional process: coagulation flocculation with two mechanical stages and one hydraulic stage, sedimentation, filtration through sand and anthracite, disinfection and pH adjustment. Eventually, Powdered Activated Carbon is added to the beginning of the process when there are taste and odor compounds in the raw water.
Processing and analysis of samples. The chemicals that were used for the laboratory tests were the same applied in the treatment plant, except the ClO2, because pre-oxidation step is not carried out in the plant. Liquid Aluminum Sulfate Type B 7.30 %Al2O3 manufactured by Sulfoquimica S.A. (Calle 55 # 46-85 Itagüí, Colombia). Powded polymer nonionic polyacrylamide N-300 PWG fabricated by Kemira Chemicals and distributed by Sulfoquimica S.A. as a flocculation aid. Chlorine 99.5 % v/v produced by Quimpac de Colombia S.A. (Km. 13 Highway Yumbo-Aeropuerto, Cali, Colombia). Quicklime 94.24% CaO manufactured by Procecal S.A. (Cr 39 # 5A-95 Medellín, Colombia). ClO2 (Purate Sodium Chlorate + Sulfuric Acid) Manufacturer AKZONOBEL-EKA (Cr 23 # 12-81 Highway Cali - Yumbo Industrial urbanization La Y, Valle del Cauca, Colombia).
To determine ClO2 concentration a spectrophotometer (DR 2000, Hach) was used employing the Standard Method (SM) D 4500 ClO2 (APHA, AWWA, WEF, 1998). THMs were determined according to Method ASTM D6520-06 using a gas chromatograph (split/SPME insert Splittles with 0.75 mm ID), flame ionization detector, electron MicroCapture and data processing system. HAAs were analyzed employing gas chromatograph with micro electron capture detector, Agilent autosampler, column - DB-1701, 30 m long, 0.25 mm id, 0.25 um thick; according to the USEPA (United States Environmental Protection Agency) 552.3 method. DOC analysis was performed by a C and N Analyzer Teledyne Tekmar Torch with combustion furnace and nondispersive infrared detector, according to SM 5310 B. UV absorbance measurements were run using a Unicam UV 500 spectrophotometer equipped with a quartz cell of 1 cm path length. The samples was previously filtered.
Raw water samples were collected at the inlet of the water treatment plant over five (5) different days during the first semester of 2012. A randomized complete block design was used where each block represented the influent water of the plant on a given day. Treatments were assigned randomly to experimental units within each block. Each block received all treatments. A jar test was used to carry out the treatments taking into account the processes of the treatment plant. Clarified water was obtained when the jar test was finished, after the pre-oxidation, coagulation, flocculation and sedimentation. This water was filtered with 0.5 um pore size glass fiber filters, previously calcined at 450 oC for 4 hours. 2.8 mg/L chlorine was added, stirred and left in the dark for 30 minutes. The pH was then adjusted to 7 with lime slurry and left in contact for 19.5 hours, which is the average maximum time water remains in the distribution system of the treatment plant. Finally, the samples were poured into vials completely filled for the analysis of THMs, and in amber bottles for the analysis of HAAs. Both, vials and the amber bottles contained crystals of sodium thiosulfate to neutralize residual chlorine.
The THMs analyzed were chloroform, bromodichloromethane, dibromochloromethane and bromoform, and the HAAs analyzed were chloroacetic acid, bromoacetic acid, dichloroacetic acid, acid bromocloroacetic acid and dibromoacetic acid.
For each block, the coagulant doses that gave the highest removal of turbidity and the highest removal of dissolved organic matter (measured as DOC and UV absorbance at 254 nm) in the clarified water were determined. These doses were designated as Sa1 and Sa2, respectively. Sa2, corresponds to a process known as enhanced coagulation [15] Later treatments were carried out with ClO2 in combination with the coagulant, in accordance with what is described in Table 1, in which Ti is the number of the treatment.
Table 1. Description of treatments.
![]()
|
|
Treatment |
Coagulant |
Oxidant |
Oxidant dose, |
|
|
dose, mL/m3 |
mg/L |
||
|
|
|
|
|
|
|
|
T1 |
Sa1 |
ClO2 |
0.3 |
|
|
T2 |
Sa1 |
ClO2 |
0.6 |
|
|
T3 |
Sa1 |
ClO2 |
0.9 |
|
|
T4 |
Sa2 |
ClO2 |
0.3 |
|
|
T5 |
Sa2 |
ClO2 |
0.6 |
|
|
T6 |
Sa2 |
ClO2 |
0.9 |
|
|
T7 |
Sa2 |
|
0 |
The T7 treatment simulates the actual conditions of maximum removal of organic matter in the plant, in order to determine if any other treatment is more efficient.
Statistical processing of information. STATGRAPHICS Centurion XVI software was used to process the information. Analysis was carried out for each variable to determine normality according to the standardized skew and kurtosis. The variables that were not distributed according to a normal distribution were transformed.
A multifactorial ANOVA test was performed for the dependent variables to determine whether there were significant differences between the means of the treatments with a confidence level of 95.0%. The null hypothesis states that there are no significant differences and the alternative hypothesis assumes the existence of these differences. The factors that were selected were the treatments and blocks. Multiple Range Tests were used to discriminate between the means by employing the Tukey's Honestly Significant Difference Test. Analysis of the variables yielded possible Pearson product moment correlation relationships between each pair of variables were explored, according to determination coefficient (R2).
3. RESULTS AND DISCUSSION
Fig. 1 indicates how full the reservoir was on the dates on which the raw water samples for the five (5) blocks were collected. Table 2 shows the parameters of raw water quality in each block.
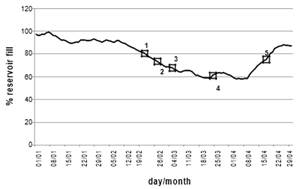
Fig.1. Percentages of reservoir fill, year 2012
Table 2. Raw water quality
|
|
|
Block |
Block |
Block |
Block |
Block |
|
|
|
1 |
2 |
3 |
4 |
5 |
|
|
Turbidity, NTU |
43.7 |
29.1 |
11.7 |
5.1 |
15.4 |
|
|
Aparent color, |
315 |
270 |
135 |
79 |
200 |
|
|
UC |
|||||
|
|
|
|
|
|
|
|
|
|
True color, |
56 |
46 |
24 |
29 |
44 |
|
|
UC |
|||||
|
|
|
|
|
|
|
|
|
|
pH |
6.78 |
7.12 |
7.10 |
6.74 |
6.86 |
|
|
Alkalinity, |
10.8 |
15.1 |
11.4 |
10.1 |
11.0 |
|
|
mg/L CaCO3 |
|||||
|
|
|
|
|
|
|
|
|
|
DOC, mg C/L |
3.73 |
3.97 |
3.54 |
3.97 |
3.40 |
|
|
UV254, 1/cm |
0.157 |
0.161 |
0.121 |
0.129 |
0.161 |
|
|
UV272, 1/cm |
0.135 |
0.139 |
0.103 |
0.109 |
0.131 |
|
|
SUVA254, |
4.21 |
4.06 |
3.42 |
3.25 |
4.74 |
|
|
L/mg-m |
|||||
|
|
|
|
|
|
|
Although the value of DOC was similar for all the blocks (standard deviation 0.36 mg C/L), there were differences in turbidity, color and SUVA254. It is generally indicated in the literature that natural waters with high SUVA254 ≥ 4 L/mg-m contain mainly hydrophobic NOM, especially aromatic material and high molecular weight fractions.
In contrast, waters with SUVA254 ≤ 2 - 3 L/mg-m contain mostly hydrophilic, non-humic and low molecular weight fractions [15]. Differences in the SUVA254 values in the blocks indicate that DOC had a different composition. In fact, the amount and characteristics of NOM are modified in different climatic periods depending on the environmental conditions of the system [7].
The minimum value of SUVA254, 3.25 L/mg-m, was obtained from the sample collected when the reservoir water level was at a minimum (Block 4). This was during the dry season when most of the organic matter was autochthonous and had a high hydrophilic character. For Block 5, a value of 4.75 L/mg-m was recorded for the SUVA254. This was mainly because of humic material from soil runoff as it was taken in the rainy season when the reservoir level was increasing.
The water level of the reservoir underwent a progressive decrease for Blocks 1, 2 and 3, whose SUVA254 values indicate that the organic material was progressively less humic. The SUVA254 value of 4.21 L/mg-m for Block 1 suggests that the organic material was composed mainly of HS. In fact, a few days before the water samples for Block 1 were collected, the reservoir was sustained at a high level typical of the rainy season.
When sampling for Block 5, the reservoir level was rising very quickly due to heavy rains and there was a high level of runoff rich in HS. The SUVA254 of Block 5 was greater than that of Block 1, although the reservoir level was lower. The same occurred with Block 2 where the levels were similar but the SUVA254 value was smaller than for Block 5. This relationship between climate period and the value of SUVA254 is consistent with findings from Rosario-Ortiz [3], who characterized the dissolved organic matter under different environmental conditions of the four (4) major tributaries of Lake Mead in the United States.
This variability of organic matter might influence the efficiency of removal and produce DBPs in varying concentrations. The water quality, raw and treated, is modified by weather conditions [2, 7]. This is revealed in the high standard deviation of the data of THMs and HAAs with treatments that reproduce the plant (T7) to five (5) blocks (Figs. 9 and 10) of 9.9 µg/L and 28.9 µg/L, respectively. Pearson product moment correlations significantly different from zero were found between the true color and UV254 (p = 0.0345) and between the true color and UV272 (p = 0.0207). In fact, the true color is formed by substances which absorb at 254 and at 272 nm, typical of chromophore compounds [19].
No correlation between DOC and UV was found, indicating differences in the characteristics of organic matter in raw water samples. This was expected due to the variation in the reservoir’s water level at the time of sampling and its relationship with the composition of organic matter.
Coagulant dose, Sa1 and Sa2. Table 3 displays the optimal dose of coagulant for the removal of turbidity (Sa1) and organic matter (Sa2) and pH found for each block
Table 3. Optimal dose of coagulant for removal of turbidity (Sa1) and organic matter (Sa2), mL/m3 and pH of the water.
|
|
Block |
pH |
dose |
pH |
dose |
|
|
|
|
|
|
|
|
|
1 |
6.10 |
28 |
5.76 |
36 |
|
|
2 |
6.73 |
24 |
6.16 |
36 |
|
|
3 |
5.28 |
24 |
4.94 |
32 |
|
|
4 |
6.06 |
24 |
5.42 |
36 |
|
|
5 |
6.17 |
28 |
5.94 |
36 |
|
|
|
|
|
|
|
The coagulant dosage to remove organic matter was greater than that required to remove turbidity (conventional coagulation). Several studies show that conventional coagulation is not able to remove significant amounts of organic matter [7]. They indicate that increased NOM removal could be achieved by coagulation, especially at lower pH values and/or higher coagulant doses (enhanced coagulation) [13].
Chow et al., [20] conducted studies using 4 different types of water and found that the highest removals of DOC were achieved with the highest doses of coagulant and the lowest values of pH. Volk et al., [21] managed to reduce the concentration of DOC after increasing the dose of coagulant in 10 surface water samples with different levels of alkalinity and TOC. Figs. 2 and 3 show the values of turbidity and DOC obtained from clarified water for the five blocks used in this study.
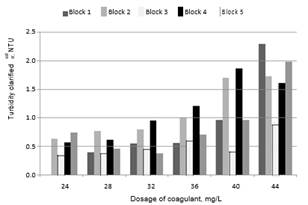
Fig. 2. Turbidity of clarified water vs. dosage of coagulant
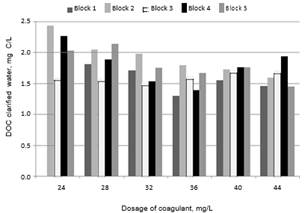
Fig. 3. DOC in clarified water vs. dose of coagulant
As the coagulant dose increased, greater amounts of DOC were removed, but turbidity increased. In general, the best conditions for the removal of NOM and turbidity are different [13, 15]. The optimum pH for removal of DOC is usually lower than the pH range for the removal of suspended particles [22], as is illustrated in Table 3.
Turbidity results. The results of the treatments for clarified water are presented in Fig. 4. Without pre-oxidant treatment (T7), clarified water with a lower average turbidity was produced. Some treatments generated higher turbidity values but had lower concentrations of DBPs (Figs. 9 and 10). Therefore, as expressed by Ghernaout [23], the dose selection of coagulant according to turbidity removal is not always the best.
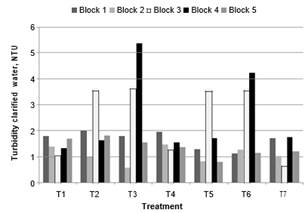
Fig.4. Turbidity of clarified water in treatments
Removal of DOC. Fig. 5 illustrates the DOC of the water clarified of the treatments.

Fig. 5. DOC of the water clarified in treatments
The DOC removals for Blocks with high SUVA254 values for raw water (Blocks 1, 2 and 5) were higher than for those with lower values of SUVA254 (Blocks 3 and 4), when a pre-oxidant was added. This is because the hydrophobic components and the high molecular weight fractions of NOM are more easily removed by coagulation than the hydrophilic NOM
[15]. Coagulation is not an effective method to remove DOC when the SUVA254 is less than 2 L/mg-m [15]. ANOVA test for normalized DOC (1/DOC) indicates significant differences between treatments (p = 0.0093). According to the Multiple Range Test, statistically significant difference was found between T3 and T4, with values of DOC of 2.38 mg/L and 1.83 mg/L, respectively. The treatment with the lowest dose of coagulant and the lowest dose of chlorine dioxide (T1) with DOC = 1.91 mg/L, was the most economical of the ClO2 assays, and produces statistically the same DOC as treatment without oxidant (T7) with DOC = 1.88 mg/L.
For these trials, the DOC slightly increases as the dose of ClO2 passes from 0.3 to 0.6 and then to 0.9 mg/L with equal doses of coagulant. This is consistent with the theory, which states that a median dose of pre-oxidant can enhance the efficiency of coagulation by increasing the number of acidic functional groups capable of binding metal hydrolysis products. However, a high dose of oxidant reduces coagulation efficiency due to the reduction in molecular weight of the organic material [24]. However, high doses of KMnO4 as pre-oxidant plus conventional process could remove NOM by oxidation, as was achieved by Lin et al., [7]. The best treatment at removing DOC was the T4. UV removal. The UV254 results for the clarified water are presented in Fig. 6. According to the SUVA254 values, Blocks 3 and 4 had the highest proportion of hydrophilic material in the raw water, and the highest values of UV254 on the clarified water, in the pre-oxidation treatment. These results were expected due to the dependence of the efficiency of coagulation on the solubility characteristics of the organic matter in the water.
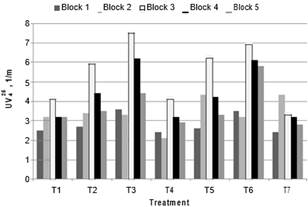
Fig. 6. UV254 of the water clarified in treatments
According to the ANOVA test, differences were found between the means of the treatments (p = 0.0003) with regard to the 1/UV254 (normalized variable) of clarified water. Multiple Range Test shows T3 was the treatment that had statistically significant difference with the treatment without oxidant (T7). Absorbance: T3 = 4.5 1/m. T7 = 3.1 1/m. The lowest absorbance at T4 (2.79 1/m) without presenting statistically significant difference with (T7). The behavior of UV254 with increasing doses of oxidant had the same trend as the results of DOC. The results of the removal of absorbance at 272 nm had the same relative efficiency as the data already analyzed at 254 nm.
Changes in SUVA. Fig. 7 and 8 illustrates the SUVA at 254 and 272 nm, respectively of the water clarified of each treatment.
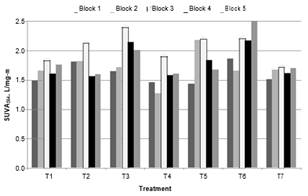
Fig. 7. SUVA254 of the water clarified in treatments
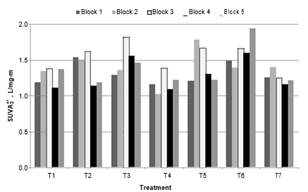
Fig. 8. SUVA272 of the water clarified in treatments
The ANOVA results of SUVA at 254 and 272 nm, normalized variables, give p-values of 0.0038 and 0.0060, respectively. Then, treatments had a statistically significant effect on SUVA . According to Tukey's Honestly Significant Difference Test, T6 (2.08 y 1.62 L/mg-m SUVA at 254 and 272 nm) had statistically significant difference with the treatment without oxidant T7 (1.645 y 1.26 L/mg-m SUVA at 254 and 272 nm).
Again, it was found that pre-oxidation at the lowest doses of ClO2 and at the highest dose of coagulant (T4) improves the removal of organic regarding treatment without oxidizing. 1.56 and 1.18 L/mg-m SUVA at 254 and 272 nm respectively, for T4. Values of SUVA254 were less of 3 L/mg-m in all the treatments, the highest was in T6. This indicates that mainly humic material was removed and that in the treated water mostly there was non-humic organic matter. According to the literature, this was to be expected bearing in mind the coagulation process used [1].
Later, the hydrophilic portion can determine the final formation of DBPs [25], although the DBPs produced by the hydrophobic organic material constitute the greatest fraction by weight. However, hydrophilic organic material is highly reactive to chlorine and produces certain DBPs that are of a higher health risk [10, 15]. Results of THMs. Fig. 9 shows the concentration of THMs generated in treatments.
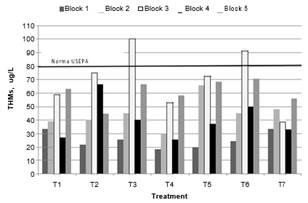
Fig. 9. THMs generated in treatments
The value established by the USEPA of 80 µg/L for THMs in drinking water were surpassed only by some treatments in Block 3. Because THMs are compounds that can potentially affect the health of water consumers, water should be supplied with the minimum possible concentration of these substances. Chloroform predominated, and bromodichloromethane was formed in some cases, but in low concentrations.
There was a general trend that shows a greater concentration of THMs as the dose of oxidant increases at equal dose of coagulant, in Blocks 3 and 4, which had the lowest humic content. THMs concentrations in treatments with ClO2 for Block 3 were the highest. This is because UV absorbance at 254 nm is related with aromatic groups of varying degrees of activation which favors DBPs formation [19] and this block contains the highest values of UV254 and SUVA254 in the treated water (Fig. 6).
For the same reason, Block 1 with low values of UV254 and SUVA254 in clarified water yielded low levels of THMs. This is consistent with the results of Hua et al., [14] who found that when ozone was used as a pre-oxidant in water of low humic nature (water from Dallas and Winnipeg), it could react with organic matter and produce more active sites in the precursors of the DBPs. Chu et al., [5] also detected higher THMs when water is more hydrophobic (more SUVA254). Block 5 had the highest concentration of THMs, in most treatments after the Block 3. It should be noted that the samples in Block 5 were collected when the reservoir was filling rapidly due to heavy rain. Therefore, it is possible that there was a high concentration of precursors in the water due to runoff, and that they were not sufficiently removed in the treatment process. Hua et al., [26], found the formation chloroform from lignin precursors. Lignin in land ecosystems and produces HS of high aromatic content [26].
THMs followed a normal distribution. The ANOVA test revealed no significant differences (p = 0.1819) between the means of the treatments. According to Tukey's Honestly Significant Difference Test a slightly lower formation of THMs occurred in T4 (37.06 µg/L) than in T7 (41.72 µg/L). Kim et al, [4], stated this is explained by the induced modifications in the organic matter due to treatment before the chlorination step, leading to the production of different amounts of DBPs. The parameters quantified in this study did not provide information on possible changes in the chemical and structural characteristics that influence the final quality of the treated wáter. Results of HAAs. The results of the generation of HAAs are illustrated in Fig. 10.
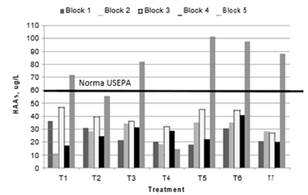
Fig. 10. HAAs generated in treatments
Some treatments exceed the limit established by the USEPA of 60 µg/L of HAAs in drinking water. Dichloroacetic acid constituted 80% to 90% of the total concentration of HAAs, the remainder consisted of chloroacetic acid and dichlorobromoacetic acid in varying proportions. Block 5, which had the highest SUVA254 in the raw water, produced the greatest amount of HAAs of all treatments.
The proportional formation of HAAs did not follow the same behavior as that discussed for the relationship between the UV254 of filtered water and the production of THMs. Indeed, THMs and HAAs formation depends on the different characteristics and compositions of organic matter. This is consistent with the findings of Ye et al., [27], who found a relationship between UV254 and THMs, but no relationship with HAAs, in 6 cities in China. Zhao et al., [28], concluded in their research that the THMs and HAAs have different precursors that exhibit differences in their removal with the coagulation process. Tubić et al. [10] found that all the fractions (both hydophobic and hydrophilic acids and non acids) have potential for formation of THMs and HAAs. However, the most reactive precursors with regard to the formation of THMs are non acidic hydrophilic fractions. On the other hand, the humic acid fraction contains the most reactive precursors with regard to the production of HAAs.
Investigations carried out from the sediment elutriate by Hong et al, [29] revealed that the fraction hydrophobic were more important precursors of chloroform and the trichloroacetic acid, while for the hydrophilic fraction relative higher dichloroacetic acid yields were observed. Bond et al., [25] found that THMs and HAAs were dependent on different classes of organic matter, and emphasizes the importance of having a better knowledge of the relative occurrence and the contribution of the precursor groups to the overall DBPs formation in different water sources. In this research the fractions of NOM responsible for the formation of each DBP was not determined, since no fractionation of NOM was carried out and the relative amount of each fraction was not known. The TOC and UV254 indicate the organic content but do not differentiate between the chemical compounds that comprise it [27].
Furthermore, a single wavelength does not give any information about the reactivity of organic matter with chlorine. According to Hua et al., [26], lignin phenols are important HAAs precursors. Bond et al., [25] reported some lignin monomers as the main precursors of HAAs. It is possible that high runoff from the reservoir, in Block 5, containing significant amounts of lignin. This could be the reason for Block 5 having high concentrations of HAAs with respect to the other blocks. However, such a theory could not be confirmed since the compounds present in the water to be chlorinated were not determined.
The best correlations found with pre-oxidation test were THMs with UV254 and UV272, and HAAs with SUVA254, where UV and SUVA was measured in the clarified water. A better characterization of organic matter in the raw water and the chlorination of its fractions, could give more information on their precursors, which should be removed to supply water with the minimum amount of THMs and HAAs.
4. ACKNOWLEDGMENTS
The authors thank Empresas Públicas de Medellín E.S.P. for funding this project.
5. Referencias Bibliográficas
[1] Matilainen, A., Gjessing, E., Lahtinen, T., Hed, L., Bhatnagar, A. and Sillanpää, M. An overview of the methods used in the characterisation of natural organic matter (NOM) in relation to drinking water treatment. Chemosphere, 83, 1431-1442, 2011.
[2] Sillanpää M. Natural Organic Matter in Water,
CharacterizationandTreatmentMethods Butterworth-Heinemann.. 2014.
[3] Rosario-Ortiz, F. L., Snyder, S. A. and Suffet, I. H. Characterization of dissolved organic matter in drinking water sources impacted by multiple tributaries. Water Res., 41, 4115-4128, 2007.
[4] Kim, H.-C. and Yu, M.-J. Characterization of natural organic matter in conventional water treatment processes for selection of treatment processes focused on DBPs control. Water Res., 39, 4779-4789, 2005.
[5] Chu, W., Yao, D., Gao, N., Bond,T., andTempleton, M. The enhanced removal of carbonaceous and nitrogenous disinfection by-product precursors using integrated permanganate oxidation and powdered activated carbon adsorption pretreatment, Chemosphere, 141, 1-6, 2015.
[6] Weishaar, J. L., Aiken, G. R., Bergamaschi, B. A., Fram, M. S., Fujii, R. and Mopper, K. Evaluation of Specific Ultraviolet Absorbance as an Indicator of the Chemical Composition and Reactivity of Dissolved Organic Carbon. Environ. Sci. Technol., 4702 - 4708, 2003.
[7]. Lin, P., Zhang, X., Wang, J., Zeng, Y., Liu, S., and Chen C. Comparison of different combined treatment processes to address the source water with high concentration of natural organic matter during snowmelt period, J Environ. Sci., 27, 51-58, 2015.
[8] Richardson, S. D. and Postigo, C. Drinking Water Disinfection By-products Springer Berlin / Heidelberg, City, 2012.
[9] Stalter, D., O'Malley, E., Gunten, U., Escher, B. Fingerprinting the reactive toxicity pathways of 50 drinking water disinfection by-products, Water Res., 91, 19-30, 2016.
[10] Tubić, A., Agbaba, J., Dalmacija, B., Molnar, J., Maletić, S., Watson, M. and Perović, S. U. Insight into changes during coagulation in NOM reactivity for trihalomethanes and haloacetic acids formation. J Environ Manage., 118, 153-160, 2013.
[11] Matilainen, A., Lindqvist, N., Korhonen, S. and Tuhkanen, T. Removal of NOM in the different stages of the water treatment process. Environ Int., 28, 457-465, 2002.
[12] Liu, H., Liu, R., Tian, C., Jiang, H., Liu, X., Zhang, R. and Qu, J. Removal of natural organic matter for controlling disinfection by-products formation by enhanced coagulation: A case study. Sep Purif Technol., 84, 41-45, 2012.
[13] Xie, Y. F. Disinfection byproducts in drinking water: Formation, analysis, and control. CRC press, 2004.
[14] Hua, G. and Reckhow, D. A. Comparison of disinfection byproduct formation from chlorine and alternative disinfectants. Water Res., 41, 1667-1678, 2007.
[15] Matilainen, A., Vepsäläinen, M. and Sillanpää,
M. Natural organic matter removal by coagulationduring drinking water treatment: A review. Adv. Colloid Interface Sci., 159, 189-197, 2010.
[16] Camel, V. and Bermond, A. The use of ozone and associated oxidation processes in drinking water treatment. Water Res., 32, 3208 - 3222, 1998.
[17] Yang, X., Guo, W. and Lee, W. Formation of disinfection byproducts upon chlorine dioxide
preoxidation followed by chlorination or chloramination of natural organic matter. Chemosphere, 91, 1477-1485, 2013.
[18] Yang, X., Guo, W., Zhang, X., Chen, F., Ye, T. and Liu, W. Formation of disinfection by-products after pre-oxidation with chlorine dioxide or ferrate Water Res., 47, 5856-5864, 2013.
[19] Korshin, G., Chow, C. W. K., Fabris, R. and Drikas, M. Absorbance spectroscopy-based examination of effects of coagulation on the reactivity of fractions of natural organic. Water Res., 43, 1541-1548, 2009.
[20] Chow, C. W. K., van Leeuwen, J. A., Fabris, R. and Drikas, M. Optimised coagulation using aluminium sulfate for the removal of dissolved organic carbon. Desalination, 245, 120-134, 2009.
[21] Volk Christian, Bell Kimberly, Ibrahim Eva, Debbie Verges, Amy Gary and Mark, L. Impact of enhanced and optimized coagulation on removal of organic matter and its biodegradable fraction in drinking water. Water Res., 34, 3247 - 3257, 2000.
[22] Duan, J. and Gregory, J. Coagulation by hydrolysing metal salts. Adv. Colloid Interface Sci., 100–102, 475-502, 2003.
[23] Ghernaout, D. The hydrophilic/hydrophobic ratio vs. dissolved organics removal by coagulation
– A review. J King Saud Univ Sci., 26, 169-180, 2014.
[24] Singer, P. C. Formation and control of disinfection by-products in drinking water. AWWA, 1999.
[25] Bond, T., Henriet, O., Goslan, E. H., Parsons, S. A. and Jefferson, B. Disinfection byproduct formation and fractionation behavior of natural organic matter surrogates. Environ. Sci. Technol., 43, 5982-5989, 2009.
[26] Hua, G., Kim, J. and Reckhow, D. A. Disinfection byproduct formation from lignin precursors. Water Res., 285-295, 2014.
[27] Ye, B., Wang, W., Yang, L., Wei, J. and E, X. Factors influencing disinfection by-products formation in drinking water of six cities in China. J Hazard Mater., 171, 147-152, 2009.
[28] Zhao, H., Hu, C., Liu, H., Zhao, X. and Qu, J. Role of Aluminum Speciation in the Removal of Disinfection Byproduct Precursors by a Coagulation Process. Environ. Sci. Technol., 42, 5752-5758, 2008.
[29] Hong, H. C., Huang, F. Q., Wang, F. Y., Ding, L. X., Lin, H. J. and Liang, Y. Properties of sediment NOM collected from a drinking water reservoir in South China, and its association with THMs and HAAs formation. J Hydrol., 476, 274-279, 2013.
[30] Leenheer, J. A. and Croué, J.-P. Peer Reviewed: Characterizing Aquatic Dissolved Organic Matter. Environ. Sci. Technol., 37, 18A-26A, 2003.