ARTICLE
SIMULTANEOUS QUANTIFICATION OF ANTIMALARIAL STEROIDS IN Solanum nudum EXTRACTS BY HIGH PERFORMANCE LIQUID CHROMATOGRAPHY (HPLC)
CUANTIFICACIÓN SIMULTANEA DE ESTEROIDES ANTIMALÁRICOS EN EXTRACTOS DE Solanum nudum POR CROMATOGRAFIA LIQUIDA DE ALTA EFICIENCIA (CLAE)
Ena López1,6,7, Carlos López2,6, Pedronel Araque3,9, Silvia Blair4,6,7, Adriana Pabón 5,6,7,8
1 M.Sc. en Ciencias Químicas, Grupo Malaria, enapatri@gmail.com
2 M.Sc. en Ciencias Químicas, docente Facultad de Ciencias Exactas y Naturales, carlopez.udea@gmail.com
3 M.Sc. en Ciencias Químicas, docente, peam04@gmail.com
4 Magister en Historia, Docente Facultad de Medicina, Facultad de Medicina, silviablairt@gmail.com
5 Doctora en Biología, Investigadora Grupo Malaria, docente Programa de Biología, apabon72@gmail.com
6 Universidad de Antioquia, UdeA Calle 70 No. 52–21, Medellín, Colombia.
7 Sede de Investigación Universitaria, SIU, carrera 53 N° 61 – 30, Medellín, Colombia
8 Universidad del Atlántico, 080001 Barranquilla, Colombia.
9 Escuela de Ingeniería de Antioquia, Km 2 + 200 Vía al Aeropuerto José María Córdova, Envigado–Colombia.
Received: May 09th, 2014. Accepted: June 30th, 2014.
ABSTRACT
Steroids with recognized antiplasmodial activity, isolated from leaves of Solanum nudum, were quantified in hexane extracts, dichloromethane, ethyl acetate and methanol by high performance liquid chromatography. Some validation parameters were checked with desirable acceptance criteria such as linearity (r2 = 0.9999), accuracy (R = 88,25 – 102.82%), precision (CV = 0.45 to 4.87%), limits of detection and quantification (0.09 to 2.73 mg / mL). Concentrations were found at 9.73 ± 0.27; 84.58 ± 3.23; 23.32 ± 0.72; 71.34 ± 2.10; 56.50 ± 0.89 and 111.37 ± 3.31 mg compound / mg extract for tumacone A, tumacone B, tumacoside A, tumacosido B, tumaquenone and diosgenone, respectively. A clear correspondence between the found concentrations and the polarities of the solvents used in the extraction was evident. This is the first analytical approach to the study of these metabolites in plant samples of specimens of S. nudum with potential phytopharmaceutical use. It is concluded that the proposed methodology can be a good tool for the analytical determination of the studied metabolites.
Key words: Quantification, HPLC, Solanum nudum, Steroids, Antiplasmodial.
RESUMEN
Los esteroides con reconocida actividad antiplasmódica aislados de las hojas de Solanum nudum, fueron cuantificados en extractos de hexano, diclorometano, acetato de etilo y metanol mediante cromatografía liquida de alta eficiencia. Se verificaron algunos parámetros de validación con criterios de aceptación deseables tales como linealidad (r2= 0,9999), exactitud (R= 88,25– 102,82%), precisión (CV= 0,45 – 4,87 %), límites de detección y cuantificación (0,09 – 2,73 μg/mL). Se encontraron concentraciones hasta 9,73 ± 0,27; 84,58 ± 3,23; 23,32 ± 0,72; 71,34 ± 2,10; 56,50 ± 0,89 y 111,37 ± 3,31 μg de compuesto / mg de extracto para los metabolitos tumacona A, tumacona B, tumacosido A, tumacosido B, tumaquenona y diosgenona respectivamente. Se evidenció una clara correspondencia entre las concentraciones halladas y las polaridades de los solventes empleados en la extracción. Esta es la primera aproximación analítica para el estudio de estos metabolitos en muestras vegetales de especímenes de S. nudum con potencial uso fitofarmacéutico. Se concluye que la metodología planteada puede ser una buena herramienta para la determinación analítica de los metabolitos estudiados.
Palabras clave: Cuantificación, CLAE, Solanum nudum, Esteroides, Antiplasmodial
1. INTRODUCTION
Solanum nudum is a shrub belonging to the genus Solanum section Geminata; in Colombia it is widely distributed throughout Antioquia, Boyacá, Cauca, Casanare, Cesar, Chocó, Cundinamarca, Huila, Magdalena, Meta, Nariño, Norte de Santander, Putumayo, Risaralda, Santander and Valle [1]. It is known on the Pacific coast of Colombia as Zapata or Zapatico and is used by traditional healers of this region for the treatment of fevers associated with malaria [1].
From the phytochemical point of view, S. nudum presents steroidal secondary metabolite such as Solanudina, steroidal alkaloid isolated from fruits [2]. From the leaves of this plant, steroids such as tumacone A (SN–1), tumacone B (SN–2), tumacoside A (SN–3), tumacoside B (SN–4), its isomer tumaquenone (SN 5) and steroidal sapogenine, diosgenone (Figure 1) were isolated [3]
These compounds exhibit in vitro antiplasmodial activity in the FCB–2 strain of P. falciparum [4]. Also, it has been reported that steroids isolated from this plant do not have cytotoxic activity [5], or clastogenic [6], or mutagenic [7]. Furthermore, it has been shown that the aqueous extracts of S. nudum exhibit in vivo antimalarial activity, in mice infected with P. berghei [8]. Taking into account the promising results of antiplasmodial activity issued by steroids isolated from S. nudum; it is interesting to continue studies on this plant leading to the development and implementation of new methodologies to measure antimalarial molecules in biological matrix for the subsequent development of a plant protection from standardized extracts, ensuring the reliability of the results.
Nevertheless, the complexity of botanical extracts constitute challenges to develop detection methods that allow rapid analysis of chemical composition of medicinal plants. In addition, in pharmacokinetic and pharmacodynamic studies, the identification and quantification of metabolites of natural products in complex biological matrices also require the application of chromatographic analytical methods [9].
Numerous studies have shown that high–efficiency liquid chromatography (HPLC) is a very important technique for separating complex mixtures such as plant extracts. The high efficiency of this method and the broad possibilities for the selection of appropriate conditions for the analysis allows the separation and quantification of many chemical compounds and numerous isomers present in plants [10].
A high number of studies where quantification by HPLC has been effective in the analysis of various compounds derived from plant extracts [11,12], has been reported. Compounds as plant alkaloids and glycoalkaloids the genus Solanum [12] have also been quantified by HPLC steroidal. Similarly, this technique has been used for the characterization of steroid sapogenines in plant extracts, but not for their quantization [13], so that HPLC may be an adequate technique to determine the concentrations of the different compounds of extracts obtained, for example, populations of S. nudum from different sources or locations, since, it lacks an analytical method to determine the content of the compounds present in the S. nudum plant.
This paper reports a first approach to the simultaneous quantification of secondary metabolites of S. nudum (SN–1, SN–2, SN–3, SN–4, SN–5 and diosgenone), by HPLC, reverse phase, in order to implement it in future studies aimed at developing a phytopharmaceutical from this plant.
2. MATERIALS AND METHODS.
Solvents and standards.
Solvents such as Acetonitrile and Terahidrofurano for liquid chromatography (purity ≥ 99%) were obtained from Merck. Ultrapure water was obtained from a Millipore Simplicity system and the marker compounds (phytochemicals substance trackers) as tumacone A (SN–1), tumacone B (SN–2), tumacoside A (SN–3), tumacoside B (SN 4), tumaquenone (SN–5) and diosgenone were previously isolated from S. nudum plant.
Equipment and chromatographic conditions.
A liquid chromatograph Agilent Technologies 1200 Series (Agilent Technologies, Wilmington, USA) with degasser, quaternary pump, autosampler and diode array detector (DAD), control and acquisition software ChemStation was used. The chromatographic conditions were: column LiChroCART® C18 (250 x 4 mm ID, 5 um), C18 Guard column, column temperature 25 ° C, 20 ul injection volume, flow 1.0 mL / min, wavelength 250 nm and mobile phase: acetonitrile – water gradient with programming during 10 35:65 min, 35:65 to 80:20 in 5 min, to 80:20 for 7 min, 80:20 to 90:10 in 13 min, to 90:10 for 5 min.
Plant material.
The leaves of S. nudum plant were collected in the municipality of Tumaco (Nariño Colombia) (1 ° 41'03 ''N, 78 ° 47'01'' W) at 16 meters. A specimen of the plant is deposited in the Herbarium of the Universidad de Antioquia (HUA) under the Voucher 179201 catalog Colombian flora. Marker compounds SN–1, SN–2, SN–3, SN–4, SN–5 and diosgenone were previously obtained using the protocol for the isolation and purification of steroid compounds of malaria S. nudum Group (UdeA) which is an improved version of the method proposed by Sáez et al [3]. Briefly, the dried and ground plant S. nudum leaves were subjected to extraction by percolation exhaustively with petroleum ether, dichloromethane, ethyl acetate and methanol. The extracts obtained are put in the rotary evaporators to dryness and its fractionation started repeated times by column chromatography packed with silica gel and eluted with a gradient of dichloromethane / methanol. Subsequently preparative chromatography in thin layer chromatography plate for the complete isolation and purification of plant steroids.
Sample preparation.
20 grams of leaves of S. nudum ground with a particle size of 5 mm were collected and subjected to Soxhlet extraction in duplicate for five hours, using 250 mL of solvents of different polarity (hexane, dichloromethane, ethyl acetate and methanol) and the corresponding extracts were obtained. Afterwards, these were concentrated under reduced pressure, and weighed 5 mg of each sample of different polarity; then they were transferred to a 5 mL volumetric flask and 0.5 mL of tetrahydrofuran were added for good solubilization and were taken to 5 mL with acetonitrile – water (1: 1). The extracts were passed through a nylon filter of 0,45um and 20 uL of the solution was injected into the liquid chromatograph. The identification of steroidal compounds in the different extracts was determined by comparing the retention times of each analyte with the marker or tracer substances.
Preparation of standard solution.
5 mg of each of the marker compounds (SN–1, SN– 2, SN–3, SN–4, SN–5 and diosgenone) were weighed and 0.5 ml of tetrahydrofuran were added to ensure solubilization. Later, dilution was supplemented with acetonitrile / water (1: 1) to obtain a concentration of 1000 mg / mL
Statistical analysis.
To find the linear analysis of variance (ANOVA) for determining the significance of both the slopes and intercepts of the linear equations, the Centurion XVI STATGRAPHICS software was used.
Chromatographic Method.
The analytical parameters which were validated and implemented for quantification of steroidal compounds were: linearity, precision, accuracy, limit of detection and limit of quantification [14].
Optimization of separation: a stock solution with six marker compounds (SN–1, SN–2, SN–3, SN–4, SN–5 and diosgenone) at a concentration of 120 mg / mL was prepared, along with a sample of dichloromethane extract of S nudum and a solution of acetonitrile: water 1: 1, were taken as a control (white). Then 20 uL of each of these solutions were injected into the chromatograph.
Linearity and linear range: To assess the linearity of SN–1, SN–2, SN–3 and SN–5 six concentrations (0.5, 10, 40, 80, 120 and 160 ug / mL) were prepared. Because quantitation limits SN–4 and diosgenone were close to 3.0 g / mL, the following concentrations were tested: 3.0, 10, 40, 80, 120 and 160 mg/mL. Each concentration was prepared from a stock solution of 1000 g/mL of each marker compound. These solutions were injected in triplicate.
Precision: to find accuracy, known amounts of labeling compounds (SN–1, SN–2, SN–3, SN–4, SN– 5 and diosgenone) were added to a sample of the dichloromethane extract of the plant S. nudum, up to three concentration levels (low, medium and high). The concentrations used were 5, 25 and 50 ug/mL. The tests were performed in triplicate and the results were expressed as coefficient of variation (CV).
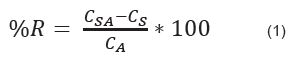
Accuracy: This parameter was found using the method of standard addition, which is used when it is not possible to prepare a blank matrix that does not contain the analytes of interest [14], therefore it is added on several real samples and known quantities of each analyte of interest up to three concentration levels (low, medium and high). To find the accuracy of this study, a sample of the dichloromethane extract of S. nudum was analyzed in chromatograph; subsequently, a replica of the same sample was doped with each of the standards (SN–1, SN–2, and SN–3, SN–4, SN–5 and diosgenone) up to three concentration levels of 5, 25 and 50 ug/mL. The samples were injected into the liquid chromatography and the tests were performed in triplicate. Results were expressed as percent recovery (% R), which was calculated as shown in equation (1).
Where:
CS = Concentration of the compound in the sample of dichloromethane extract of S. nudum
CSA = Concentration of the compound in the sample of dichloromethane extract of S. nudum, plus (+) concentration of the compound added to the sample of dichloromethane extract of S. nudum.
CA = known concentration of the compound marker added to the sample of dichloromethane extract of S. nudum.
Limit of detection and limit of quantification: to evaluate the detection limit of each steroid compound, concentration corresponding to three times the signal / noise ratio (3: 1) was calculated and for the limit of quantification, the corresponding concentration was calculated to ten times the ratio signal / noise (10: 1). These concentrations obtained were subsequently injected into the chromatograph to find out which experimentally obtained value was equal to that calculated.
3. RESULTS Y DISCUSSIONS
3.1 Parameters for quantification
Optimization of the separation: When performing a simultaneous measurement of all metabolites (SN–1, SN–2, SN–3, SN–4, SN–5 and diosgenone) at a concentration of 120 ug/mL, it was observed that all the peaks of the compounds were well defined, had good resolution (greater than 2 in each case) and did not present problems of co–elusión (figure 2A). Compounds SN–4, SN–5 and SN–3 eluted first with a retention time (RT) from 12.31 to 14.85 minutes, respectively, compounds SN–2 and SN–1 eluted in a RT from 16.57 to 17.65 minutes respectively. These results are consistent with the polarity of the compounds, allowing greater solubility in the mobile phase. By contrast, diosgenone eluted in a greater RT: 37.49 minutes, because it is the less polar metabolite. Likewise, the chromatogram of a dichloromethane extract of S. nudum sample was obtained; it was observed that the compounds have no interference, facilitating the quantification of steroid compounds (Figure 2B).
Linearity and linear range: linear regression analysis was performed and the concentration versus areas to compound was plotted, yielding statistical results found in Table 1. Values obtained in the statistical test (α = 0.05) show slopes statistically different from zero (p <0.05) which indicates a good sensitivity of the method, as well as an intercept for each negligible compound (p> 0.05). It was also observed that all the coefficients of determination were greater than 0.999 indicating that there was good proportionality between concentration and the areas of each analyte, the errors of the slopes and intercepts show a good fit to the linear model.
Limit of detection and quantification: The concentrations that provided superior results to three times the signal / noise ratio for the detection limit and 10 times to the limit of quantification, are shown in Table 1. It was found that the estimated values for both, detection and quantitation limits ranged from 0.09 to 0.82 and from 0.30 to 2.73 g/mL, respectively, indicating that the analytical method has good sensitivity.
Precision: the coefficients of variation (CV) of each of the steroid compounds at three concentration levels were in the following ranges: for the low level was (0.45 to 3.79%), intermediate (0.61– 4.87%) and high (0.69– 2.15%) (Table 2). According to the Association of Official Analytical Chemists (AOAC) [9], a CV less than or equal to 7.3% for concentrations around 10 mg / mL is accepted; and for concentrations close to 100ug/mL, the CV must be less or equal to 5.3% (Table 2). It can be seen that the CVs of this study are below the maximum value established by the Association of Official Analytical Chemists (AOAC) [14], therefore the method is considered accurate.
Accuracy: The recovery percentages for each of the steroid compounds at three concentration levels were in the range: for the low level 89.58% – 100.82%, average 88.25 to 95.32% and high level 91.15 to 98.31% (Table 3). Under AOAC acceptable recovery percentages for low concentrations (between 5 and 10 mg / mL) is between (80 –110%); and higher concentrations (between 25 and 100 ug/mL) is (80 – 107%) [14]. The results of this study are within the stated ranges; this indicates that the method has no analyte losses (<80%) or matrix interference (> 110%); therefore the chromatographic method is considered accurate.
3.2 Application of the method in different extracts of Solanum nudum.
3.3 Figures
3.4 Tables
The quantification of the S. nudum steroids was performed in extracts prepared with different polarity solvents (hexane, dichloromethane, ethyl acetate and methanol). In the hexane extract was observed that the major component was the diosgenone, for dichloromethane and ethyl acetate was SN–2 and for the methanol extract was SN–4 (table 4). The ANOVA test was applied to compare the concentration of compounds in each extract; it was found that in all cases at least a concentration differs from the other (p <0.05). When the test of pair–wise comparisons of compounds were carried out to determine what metabolites differed in their concentration in each extract, it was noticed that most of the concentrations of these compounds differ among themselves, except for some cases as follows: in the ethyl acetate extract, concentrations of SN–4 and diosgenone compounds (p = 0.326) and the methanol extract SN–2 and diosgenone (p = 0.075) showed no significant differences statistically. These results are related to the polarity of molecules and the affinity of each of them with the solvent. Analyzing molecules structurally and solvents extraction systems, it was observed that diosgenona is extracted efficiently with hexane since it is a compound of low polarity. SN–1 and SN– 2 with dichloromethane and ethyl acetate for their medium polarity; and SN–3, SN–4, SN–5 are best extracted with methanol suggesting that are highly polar compounds.
4. CONCLUSIONS
In this study, simultaneous quantification of steroid compounds in S. nudum samples by high efficiency liquid chromatography (HPLC) on reversed phase was achieved. This method showed appropriate separation of the compounds, since there was no co–elusion between them. The method also showed acceptable linearity for determining coefficients of 0.999 and desirable precision with CV less than 5% was obtained according to the AOAC criteria, it means that, this method complies with the parameter of repeatability. Furthermore, the method presented acceptable accuracy with greater recovery rate of 80% and less than 110%, intervals that are within the range set by the same organization. The results obtained in this study suggest that it is a reliable method and the methodology can be applied to simultaneous analysis of steroids SN–1, SN–2, SN–3, SN–4, SN–5 and diosgenone in the vegetable matrix (extracts of different polarity); process required in the development of a phytopharmaceutical.
5. ACKNOWLEDGEMENTS
This research study was funded by the Ministry of Agriculture of Colombia ''Ministerio de Agricultura de Colombia'' under the project ''evaluation of antiplasmodial activity of standardized extracts of the Solanum nudum plant, which is native and cultivated in vitro'' V7552–29–07 code 009–2007. It was also funded by Universidad de Antioquia (UDEA), under the program sustainability strategies 2014 – 2015. The authors want to give special thanks to Felipe Cardona for the collection and taxonomy of the plant at Herbario de la Universidad de Antioquia (HUA) and to Natalia Yepes for her support in the implementation of the High Efficiency Liquid Chromatography (HPLC) technique.
6. BIOGRAPHICAL REFERENCES
[1]. Blair, S.; Madrigal, B., Plantas antimaláricas de Tumaco: Costa Pacífica Colombiana. Antioquia, E. U. d., Ed. Medellín,; pp 266–270, 2005.
[2]. Usubillaga, A. Solanudine, a steroidal alkaloid from Solanum nudum. Phytochemistry., 27 (9), 3031–3032, 1988.
[3]. Saez, J., Cardona, W., Espinal, D., Blair, S., Mesa, J., Bocar, M., Jossang, A. Five new steroids from Solanum nudum, Tetrahedron., 54 (36), 10771–10778, 1998.
[4]. Pabon, A., Carmona, J., Maestre, A., Camargo, M., Blair, S. Inhibition of P. falciparum by steroids isolated from Solanum nudum, Phytother Res., 16 (1), 59–62, 2002.
[5]. Londoño, B., Arango, E., Zapata, C., Herrera, S., Saez, J., Blair, S., Carmona, J. Effect of Solanum nudum Dunal (Solanaceae) steroids on hepatic trophozoites of Plasmodium vivax, Phytother Res., 20 (4), 267–73, 2006.
[6]. Alvarez, G., Pabon, A., Carmona, J., Blair, S. Evaluation of clastogenic potential of the antimalarial plant Solanum nudum, Phytother Res., Vol. 18, pp 845–8, 2004.
[7]. Pabon, A., Blair, S., Carmona, J., Zuleta, M., Saez, J. Evaluation of the mutagenicity of antimalarial products isolated from Solanum nudum (Solanaceae), Pharmazie., 58 (4), 263–7, 2003.
[8]. Echeverri, M., Blair, S., Carmona, J., Perez, P. Effect of Solanum nudum extracts on the liver of mice infected with Plasmodium berghei. Am. J. Chin. Med., 29 (3–4), 477–484, 2001.
[9]. Wang, B., Ji, S., Zhang, H., Zhao, L., Lv, L., Li, Y., Zhou, G., Zhang, G. Liquid chromatography tandem mass spectrometry in study of the pharmacokinetics of six steroidal saponins in rats, Steroids, 78, 1164 –1170, 2013.
[10]. Anwar, G., Hemn, Q., Nabil, F. Analysis of Phenolic Compounds in Extracts of Ziziphus spinachristi using RPHPLC method, J. Chem. Pharm. Res., 4(6), 3158–3163, 2012.
[11]. Wang, Y.C., and Yang, Y–S. Simultaneous quantification of flavonoids and triterpenoids in licorice using HPLC, J. Chromatogr. B., 850, 392– 399, 2007.
[12]. Jorge, R., Abreu, M., Barreto, J., Silva, F., Lópes, M., Dewey, J., Kenupp, J. A Validated Reverse Phase HPLC Analytical Method for Quantitation of Glycoalkaloids in Solanum lycocarpum and Its Extracts, J. Anal. Methods. Chem., 1–9, 2012.
[13]. Kikakedimau, R., Luyindula, S., Doumas, P., Schie, H., Baissac, Y., Cimanga, R., Diamuini, A., Bulubulu, F., Jay–Allemand, C. Phytochemical analysis of Phyllanthus niruri L. (Phyllanthaceae) extracts collected in four geographical areas in the Democratic Republic of the Congo, Afr. J. Plant Sci., 7(1), 9 – 20, 2013.
[14]. Aguirre, L., García, F., García, T., Illera, M., Jucandella, M., Lizondo, M., Lluch, A., Martin, M., Mateos, B., Ochoas, C., Ortega, M., Pujol, M., Reig, M., Torres, M. Validación de métodos analíticos. En: Parte II: Validación de métodos de análisis en materias primas y especialidades farmacéuticas. AEFI. Barcelona, pp 45 –130, 2001.